
by Cherisa Kmetovicz, Keysight Technologies (formerly Agilent Technologies electronic measurement business)
External mixers can help extend the capabilities of signal analyzers so these instruments can handle frequencies ranging into several hundred gigahertz.
Short-range connections are increasingly making use of millimeter-wave signals. Application examples include satellite-to-satellite links, point-to-point radios, secure communications, and wireless audio and video connections. Measurements of millimeter-wave signals between 30 and 300 GHz often depend on the use of an external mixer. The mixer becomes the front end of instruments such as microwave signal analyzers, bypassing the input attenuator, preselector and first mixers. This economical technique can extend measurements to 325 GHz and beyond.
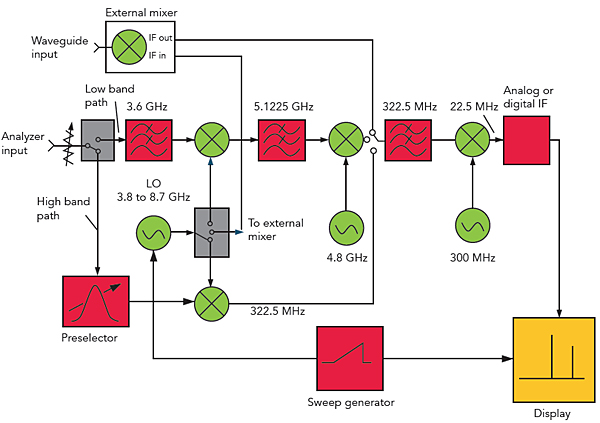
The external mixer uses a harmonic of the analyzer’s local oscillator (LO) to down-convert the input signal. The LO output of the analyzer is sent to the intermediate frequency (IF) input of the mixer. The analyzer sets the outgoing LO signal to a frequency that will mix down the signal of interest to be within the analyzer’s IF range.
This method has two important tradeoffs. First, external mixing has the potential to reduce amplitude sensitivity because there is no preamplifier; however, the resulting sensitivity may still be quite good. Second, it may increase system phase noise because harmonics of the LO typically have greater phase noise than that of the fundamental.
Typically, a signal analyzer that supports external mixing has one or two additional connectors on its front panel: an “LO out” port that routes the analyzer internal first LO signal to the external mixer, and an “IF in” port that accepts the mixer IF output.
An extension of this capability is a “smart mixer” that improves the measurement performance and functions available through external mixing. Using a built-in USB link, each mixer can identify itself by model and serial number. It can also provide information such as harmonic number, LO path-loss data and conversion-loss calibration data.
To further simplify test setups, the latest analyzers have a single diplexed port that sends an LO signal that ranges from 3 to 14 GHz and receives a 322.5 MHz IF signal from the external mixer. With this wide difference in frequency, a single coaxial interconnect cable can carry both signals.
External mixing products
An external mixer typically uses higher harmonics of the signal analyzer’s first LO; in some cases, the first LO frequency is doubled before being sent to the external mixer. Use of higher fundamental LO frequencies helps reduce mixer conversion loss, which is inescapable but correctable on the analyzer display through digital compensation.
The LO and its harmonics mix with all signals present at the input, including the desired input signal and all out-of-band signals. This generates mixing products that can be processed through the first IF along with valid signals.
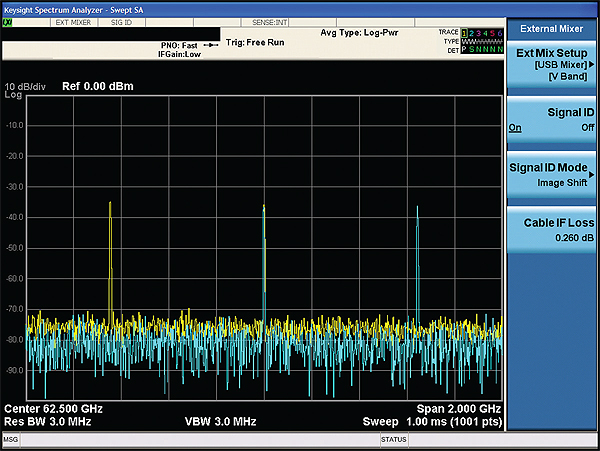
Most signal analyzers use a tunable preselection filter, or preselector, to attenuate unwanted signals before they reach the mixer. An external mixer that lacks a preselector will produce false responses or images that appear on the analyzer display. A function called “signal identification” can deal with these unwanted artifacts.
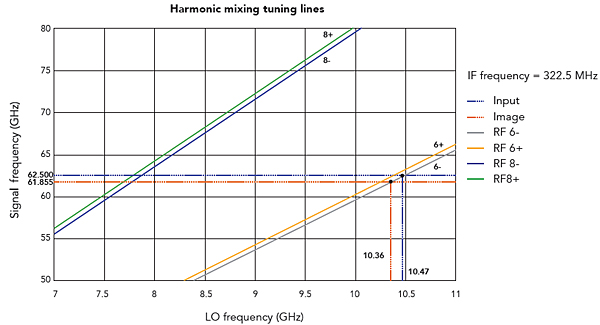
An example will illustrate how this works. Keysight analyzers have an IF of 322.5 MHz. Assume the hardware is a 50-GHz signal analyzer connected to an unpreselected external mixer that covers 50 to 75 GHz (V-band) and uses “six minus” (6–) mixing, which is the lower of the two responses produced by the sixth harmonic of the 322.5 MHz IF.
If the measured signal is at 62.5 GHz, the correct response will appear at that frequency and the companion mixing product will appear at an indicated frequency of 61.855 GHz, which is below the real response by 645 MHz (twice the 322.5 MHz IF).
Using the fundamental behavior of mixing, a signal analyzer can identify the real signal and reject the false component. A technique called image shift retunes the LO frequency on alternate sweeps. The retuning is given by the equation (2 x fIF)/N where fIF frequency, N is a given harmonic of the LO, in this case, -6. Image shifting shifts the Nth harmonic by twice the IF frequency, thereby causing the desired signal to appear in the center of two overlapped display traces while a single image component appears in each trace above or below the correct signal.
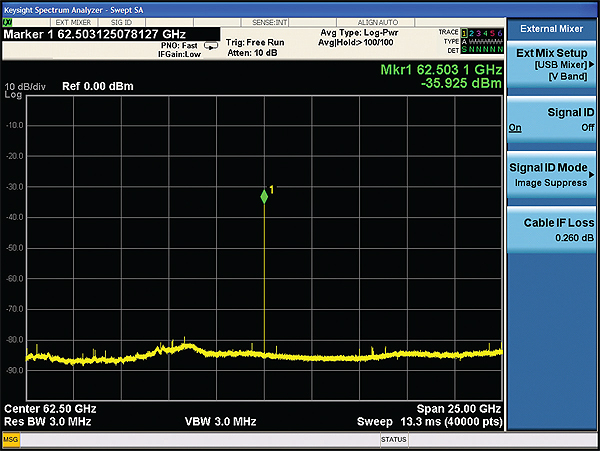
An extension of this technique is the “image suppression” method. This mode takes two sweeps using the minimum hold function, which saves the smaller value of each display point from each sweep. The first sweep uses the normal LO tuning value, while the second sweep offsets the fundamental LO frequency by (2 x fIF)/N. As with image identification, the correct harmonic will appear at the same place on the display, producing a high value in each sweep. Because the unwanted images will produce a high value in one sweep and a low value in the other, only the low will display.
It is important to note that the two signal-identification methods produce correct frequencies but yield less-precise amplitude values. Once the correct frequency component has been identified, the next step is to turn off the signal-identification mode and zoom in on the signal by narrowing the measurement span.
To ensure accurate amplitude measurements, it is necessary to first enter the calibration data for the external mixer. Normally, the mixer manufacturer will provide this data in tabular form with conversion loss in dB at a number of frequency points across the mixing band. These values are entered into a correction table in the signal analyzer, which then uses the data to compensate for mixer conversion loss.
The smart mixers described here remove the chance of human error by automatically transferring conversion-loss information into compatible signal analyzers through a USB connection. This calibrates the signal analyzer reference level at the input of the external mixer.
Even when working at higher frequencies, the signal analyzer must also handle a variety of measurement and analysis tasks. They include making application-specific measurements such as adjacent-channel power (ACP), noise figure and phase noise; performing digital modulation analysis defined by industry standards such as LTE, 802.11 or Bluetooth; and performing vector signal analysis of highly complex signals. Many signal analyzers have these capabilities built in or offer them through “measurement apps” integrated into the instrument interface.
The complementary cumulative distribution function (CCDF), which shows power statistics, is another measurement capability built into many of today’s signal analyzers. CCDF measurements provide statistical information such as the percentage of time the instantaneous power of a signal exceeds the average power by a certain number of decibels. This information is important in the design and development of power amplifiers, which must handle instantaneous signal peaks with minimum distortion within designs intended to minimize cost, weight and power consumption.
Other examples of signal analyzer measurements include occupied bandwidth, third-order intercept (TOI), harmonic distortion and spurious emissions. Here, fundamental instrument settings, such as center frequency, span, and resolution bandwidth, depend on the specific radio standard to which a device is being tested. Many modern signal analyzers have the necessary settings stored in memory, saving time and ensuring accurate results.
Another example is measurement of noise figure, which directly affects the sensitivity of receivers and other subsystems. Although dedicated noise-figure analyzers are available, some signal analyzers handle these measurements as an optional capability. This option provides control of the noise source that drives the input of the DUT and also includes the firmware needed to automate the measurement process and display the results.
Phase information
Digital modulation techniques use phase and amplitude information to carry more baseband data in a limited amount of spectrum and period of time. That is why today’s signal analyzers handle phase and amplitude data, which is essential to understanding the in-phase and quadrature (I/Q) components of complex modulation schemes. Fortunately, this information is retained when using external mixing.
Complete demodulation and analysis requires vector signal analysis software. This enables essential measurements, such as error vector magnitude (EVM), which is a key metric for the quality of digitally modulated communication signals. Of course, pure amplitude measurements are still needed to determine signal characteristics such as flatness, adjacent-channel power levels and distortion.
All in all, external mixing techniques can be used to extend the frequency range of proven microwave signal generators and vector network analyzers. This saves time and effort, and helps ensure meaningful measurement results.
References
Keysight Technologies
keysight.com