by Peter Semig and Collin Wells, Texas Instruments
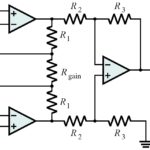
There are numerous publications from the past two years that discuss the theoretical linear operating region of instrumentation amplifiers. The publications cover the three primary topologies of instrumentation amplifiers: three-op-amp,[1] twoop-amp,[2] and two-op-amp with gain stage,[3] which are shown in Figure 1.

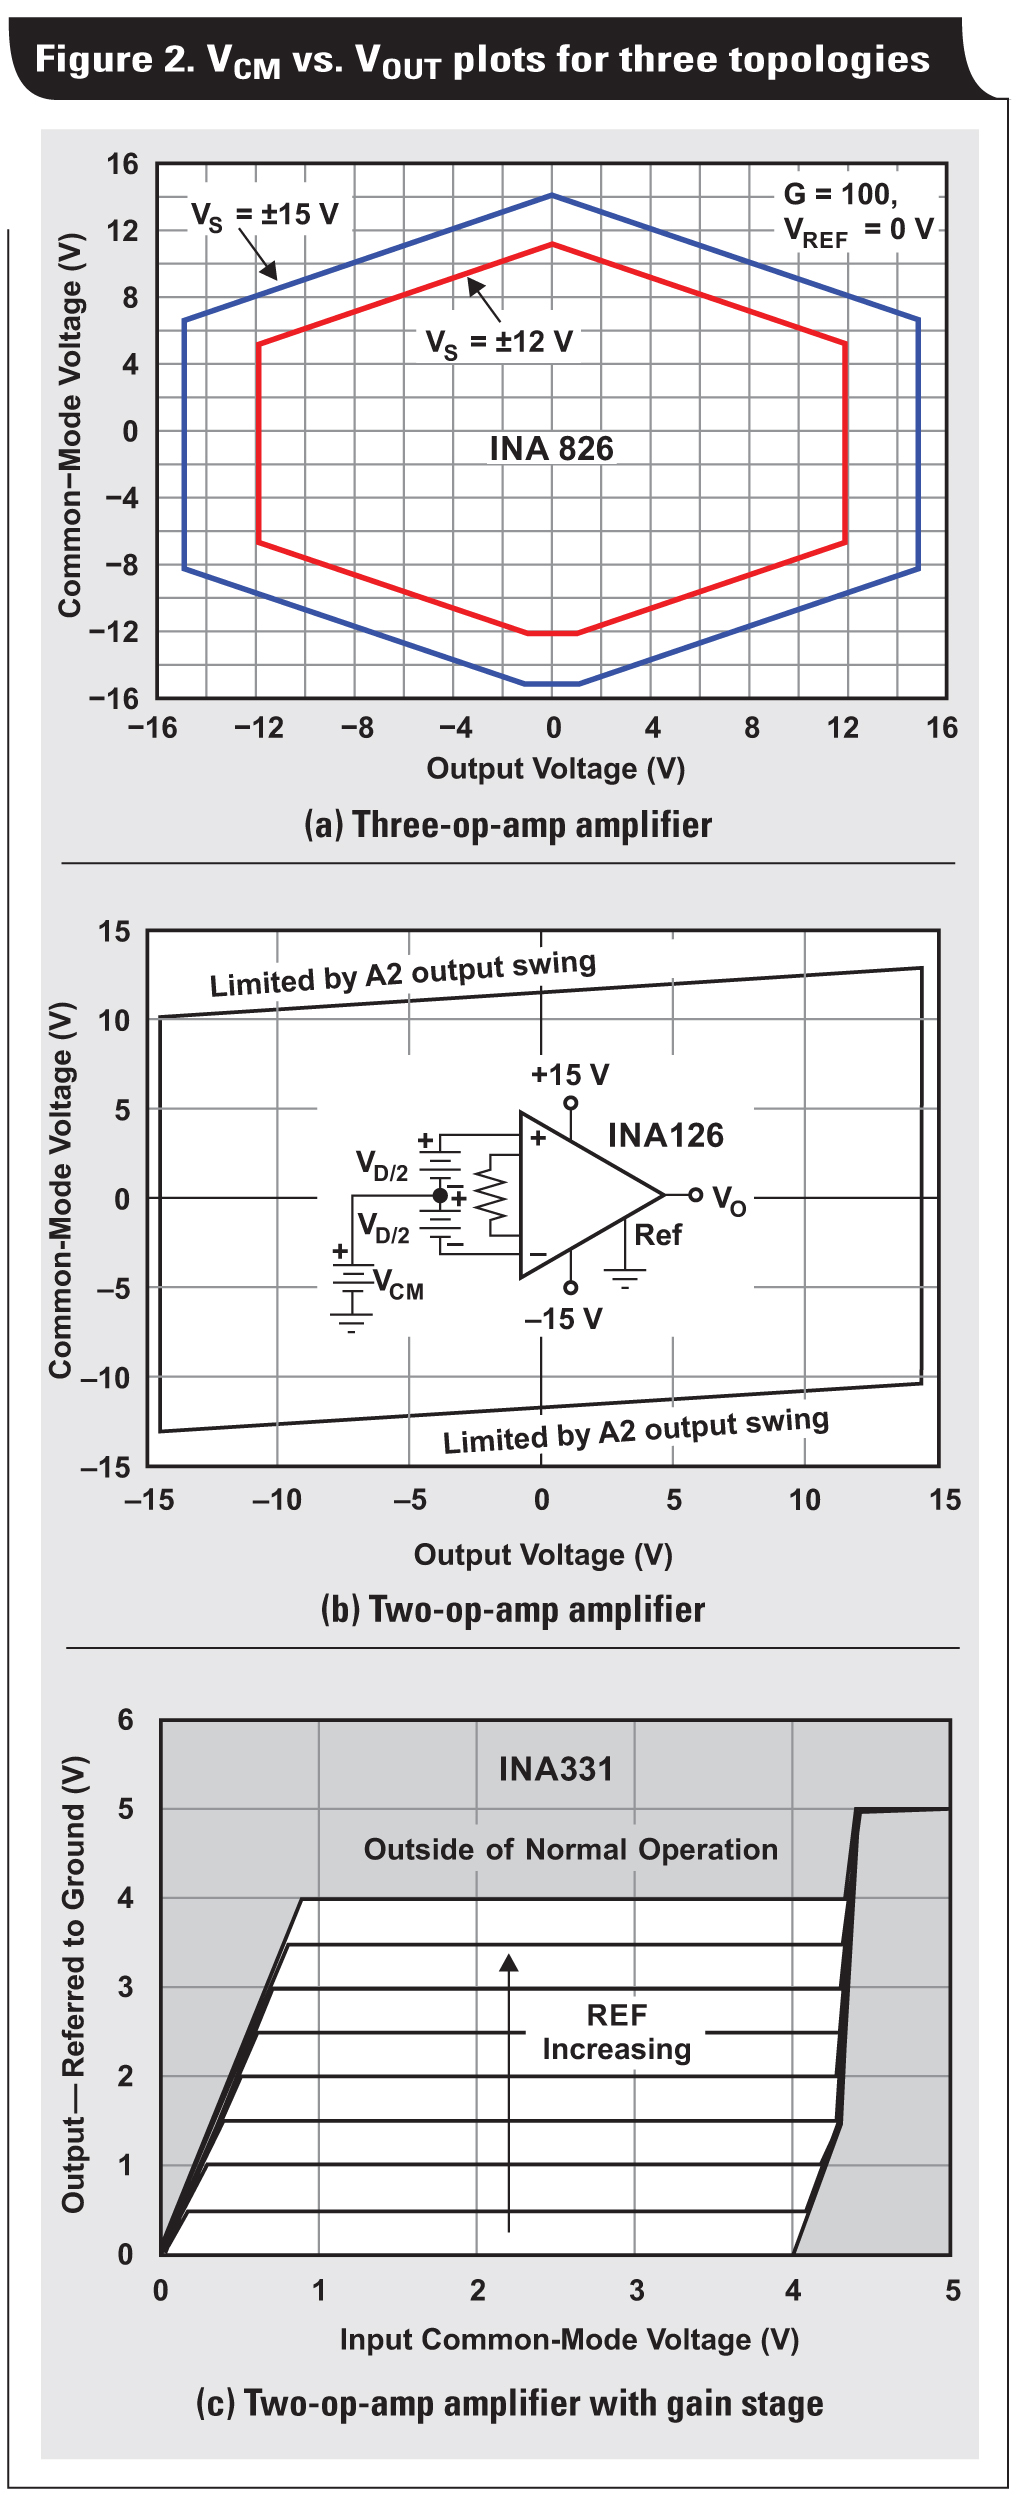
Each publication derives the node equations that define the linear operating region of the device, which is represented by a plot of common-mode voltage (VCM) versus output voltage (VOUT). In addition to topology, the VCM vs. VOUT plot depends on supply voltage, gain (G), and reference voltage (VREF). Example plots for each topology are shown in Figure 2.
While plots for commonly used circuit configurations are usually included in the devices’ data sheets, systems may have other requirements. Given the complex nature of the linear operating region and limited selection of plots in instrumentation-amplifier data sheets, an easy-to-use software tool is necessary. Therefore, the stand-alone downloadable VCM vs. VOUT Calculator tool was developed to enable designers to generate VCM vs. VOUT plots for many different instrumentation amplifiers based on topology, supply voltage, gain, and reference voltage. Figure 3 depicts the graphical user interface for the software tool.
To reinforce the understanding of the linear operating region of instrumentation amplifiers, this article focuses on the correlation of theoretical and measured results. The linear operating region of instrumentation amplifiers was measured and compared to theoretical results.

Measurement system
To create a VCM vs. VOUT plot for an instrumentation amplifier, the measurement tool must be able to vary the instrumentation amplifier’s common-mode input voltage and the differential input voltage (VDIFF) while monitoring the output voltage. To detect small deviations in the linearity of the output signal, the system must have an accuracy that is greater than or equal to the linearity specification of the instrumentation amplifier under test. The typical input-stage nonlinearity of an instrumentation-amplifier is in the range of 0.05% to 0.001%, which defines the accuracy requirement for the measurement system. Furthermore, the gain and offset errors of the instrumentation amplifier must be removed at each common-mode voltage to identify only the linearity error.
Measurement system hardware
There are three main requirements of the measurement system hardware. First, three power supplies are required to control the supply voltages (V+, V-) and VREF of the instrumentation amplifier.
Secondly, two accurate, high-resolution voltage sources are required for controlling the instrumentation-amplifier VDIFF and VCM voltages. The first source controls the common-mode voltage by connecting between GND and the negative input (–IN) of the instrumentation amplifier. The second source controls the differential voltage by connecting between the –IN and +IN inputs. This setup allows for fine control of the VDIFF voltage and course/fine control of the VCM voltage.
The third requirement is for high-accuracy voltmeters to monitor the VDIFF and VOUT voltages. The highest precision DC voltmeters available should be used to accurately monitor VDIFF and VOUT. Monitoring the input voltage accurately is extremely important because most voltage sources lack the accuracy to control the input to levels less than the linearity of the instrumentation amplifier. A meter is not required for VREF because when VDIFF is set to zero, VOUT will equal VREF plus the offset voltage of the instrumentation amplifier, which is calibrated at each VCM voltage level. Figure 4 shows a circuit representation of the VCM vs. VOUT test system.

Measurement-system software
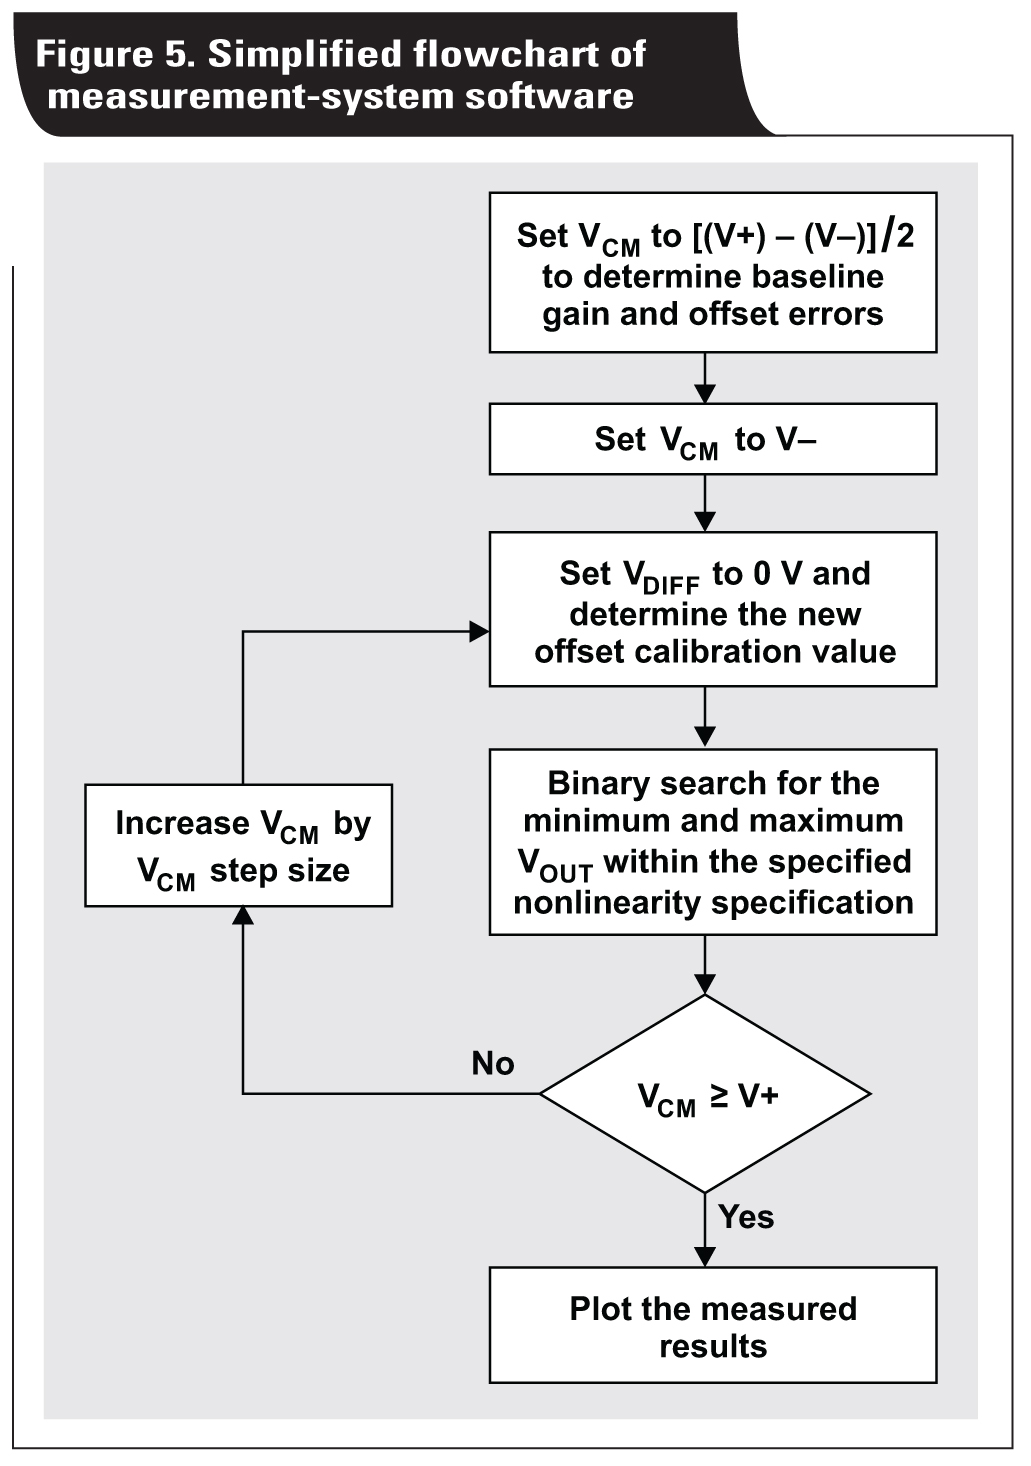
The measurement-system software automates the generation of the VCM vs. VOUT plots for different configurations of instrumentation amplifiers. The software controls the VDIFF voltages to produce VOUT voltages over the full power-supply range and monitors for deviations greater than the data-sheet nonlinearity specification. The software performs this function at each desired VCM level. The system selects appropriate input voltages based on the gain, power supply, and reference voltage. A binary search algorithm intelligently manipulates the inputs to determine the final output voltage within the programmed linearity specification. A simplified flow chart for the software system is shown in Figure 5.
Summary of Results
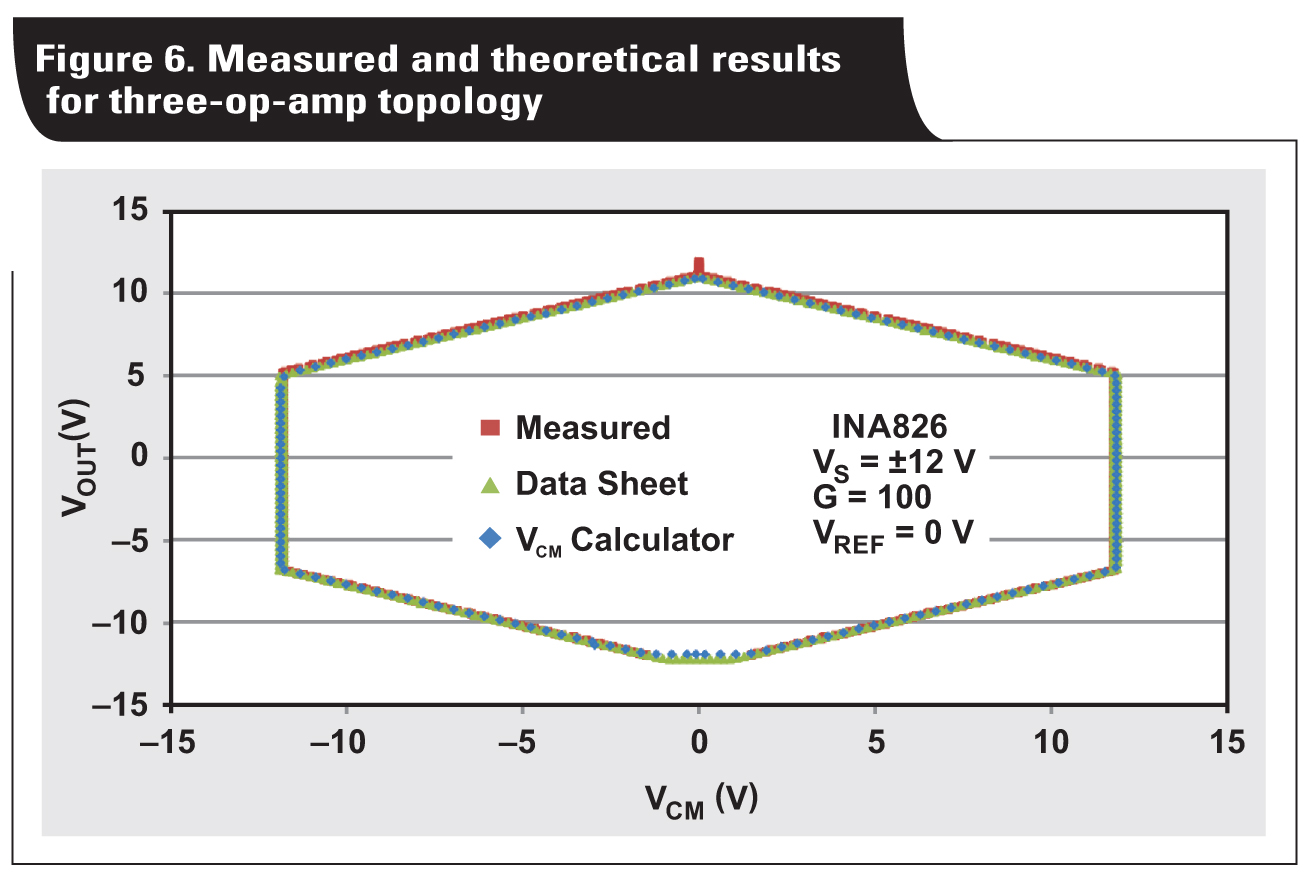
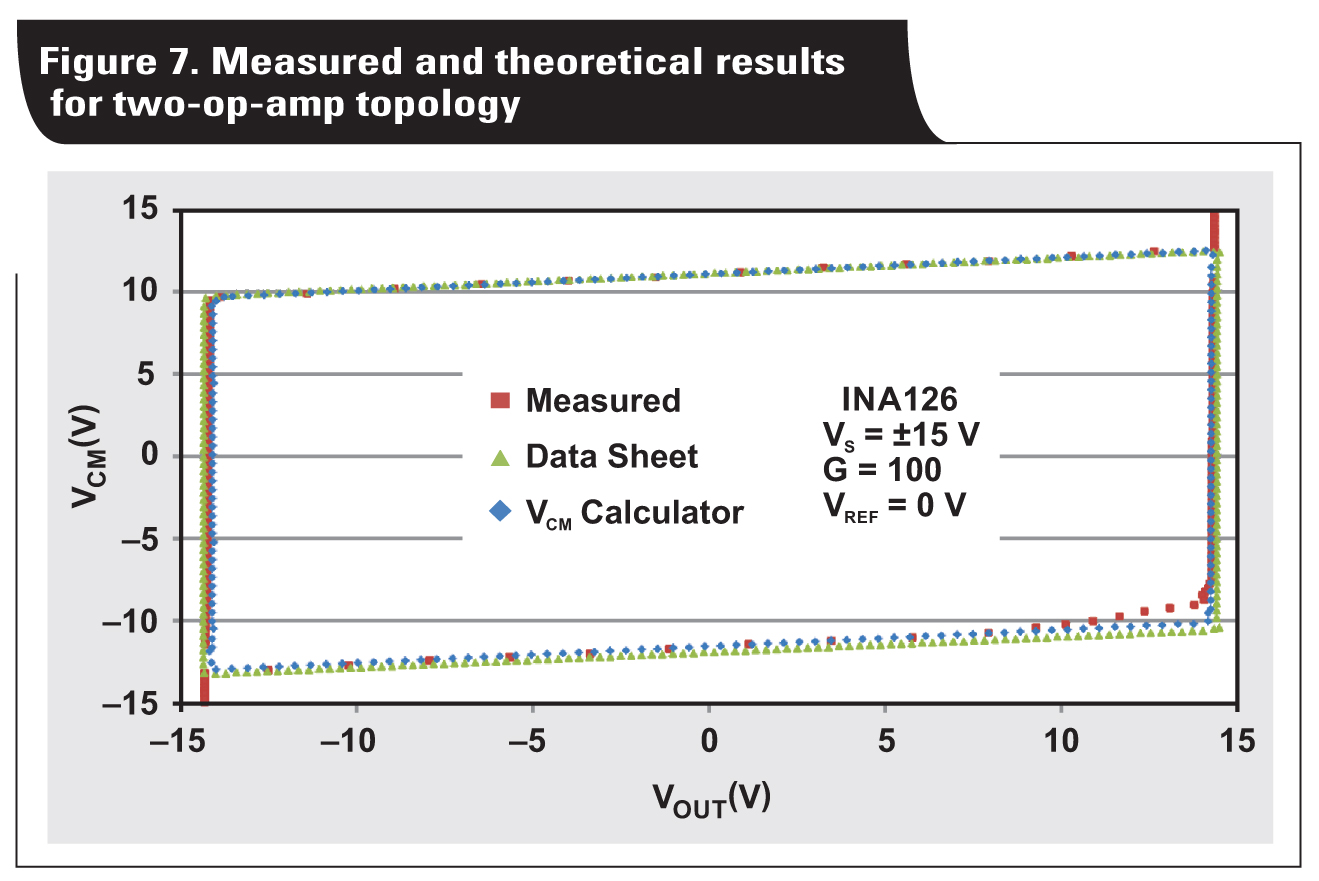
Using the measurement system, the linear operating region of multiple instrumentation amplifiers was measured to verify correlation with theoretical results. Figure 6 shows the results for a three-op-amp instrumentation amplifier. Figure 7 depicts the results for a two-op-amp instrumentation amplifier.
Notice that both Figure 6 and Figure 7 have very high correlation between theoretical and measured results. Figure 8 depicts the results for a two-op-amp with gain-stage instrumentation amplifier.
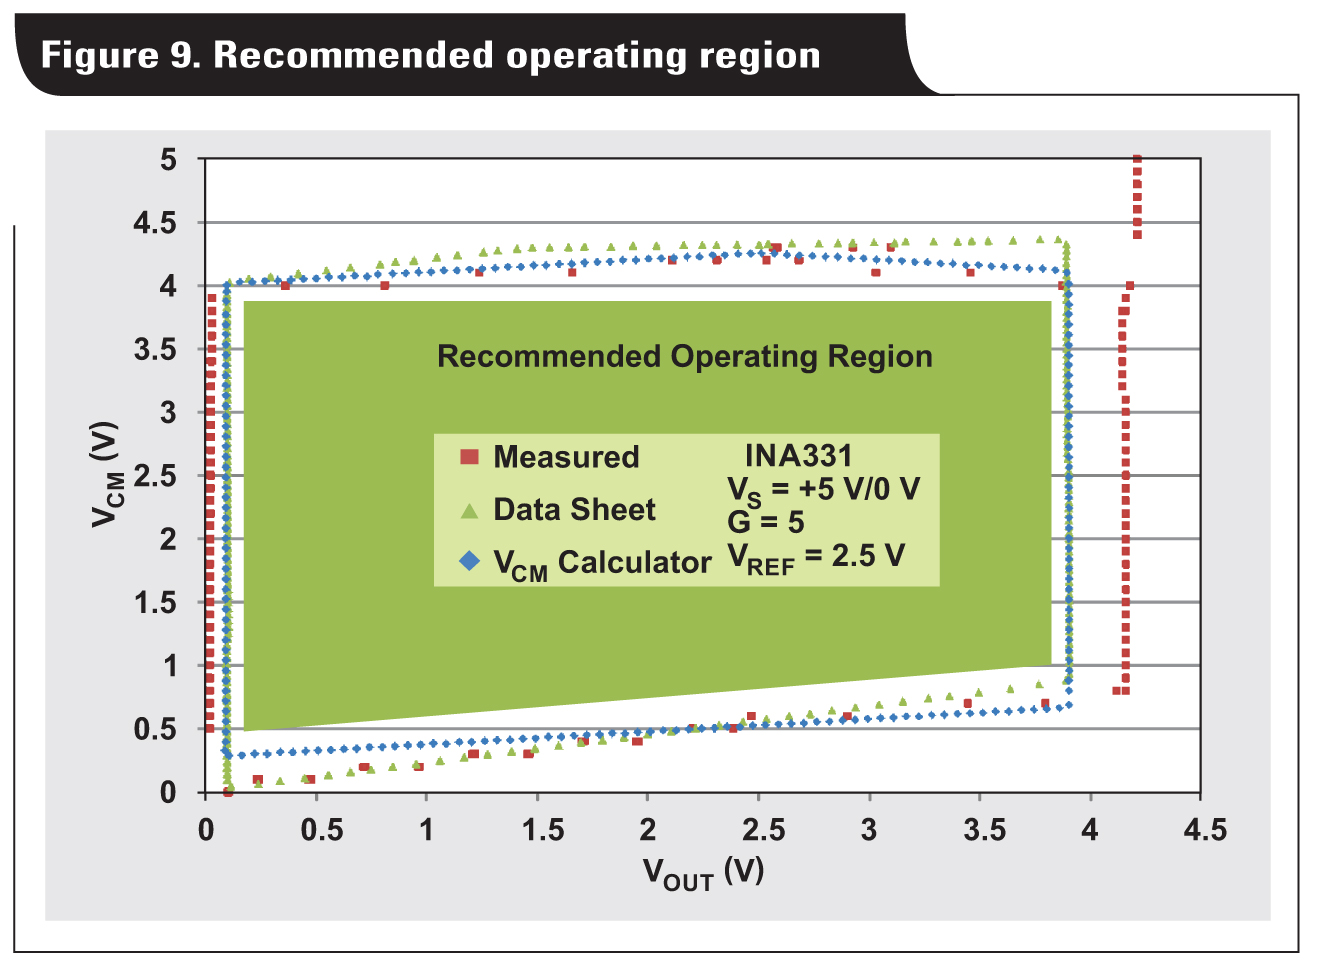
While Figure 8 shows high correlation between the VCM Calculator and data-sheet results, notice that there are some regions where the measured results extend beyond the theoretical results. These instances are especially apparent near the minimum and maximum output voltages. There are many possible reasons for this, including process shift, temperature, load current, and so on. Note that the VCM vs. VOUT plot(s) in instrumentation-amplifier data sheets are considered typical specifications, which represent approximately 68% of all devices. While it is possible to obtain a device whose measured linear operating region is a superset of that shown in the data sheet, the opposite is also possible. There are a couple such regions shown in Figure 8. Therefore, it is good design practice to operate well within the linear operating region of the instrumentation amplifier as shown in Figure 9 on the following page.

Conclusion
This article verified the theoretical linear operating region of the three most common topologies of instrumentation amplifiers by presenting a sophisticated measurement system for VCM vs. VOUT plots. The measured results correlate well with the theoretical linear operating region. This correlation supports using the VCM vs. VOUT Calculator to determine the linear operating region of instrumentation amplifiers with atypical configurations. To simplify the task of identifying the linear operating regions of instrumentation amplifiers in future designs, regularly download and install VCM vs. VOUT Calculator. Finally, be sure to operate well within the plot to account for variations over process and temperature.
References
- Peter Semig and Collin Wells, “Instrumentation amplifier VCM vs. VOUT plots,” Part 1, Part 2 and Part 3, EDN Network, December 2014
- Peter Semig, “VCM vs. VOUT plots for instrumentation amplifiers with two op amps,” Analog Applications Journal (SLYT647), 4Q 2015
- Peter Semig, “Linear operating region of two-op-amp instrumentation amplifiers with gain stages,” Analog Applications Journal (SLYT683), 3Q 2016
Pete Semig and Collin Wells are both Analog Applications Engineer with Precision Amplifiers with Texas Instruments.