Part 1 of this FAQ was a basic introduction to the context and concept of S-parameters. Part 2 looks at their measurement, application, and relationship to the time domain.
Q: How do you actually measure S-parameters?
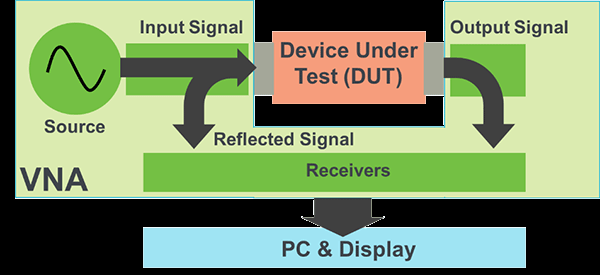
A: In general, except for approximate measurements, you cannot use a spectrum analyzer alone for this frequency-domain test. Instead, there are two dedicated, specific classes of instruments: the network analyzer, which can set-up and measure the scalar S-parameters, and the vector network analyzer (VNA), which also measures the vector (real and imaginary) S-parameters (Figure 1).
Different instruments are available for a variety of maximum frequency ranges, such as up to 1 GHz, 10 GHz, and even into the tens of GHz. Of course, the cost goes up with each increase in range. There are also 4-port analyzers for differential circuits.
Q: What is the physical set-up using a VNA?
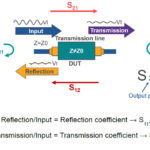
A: The VNA uses a precise sine wave and sweeps the frequency as a narrow-band receiver tracks the swept input response. This narrow-band receiver achieves low noise and high dynamic range of the VNA. It looks simple enough, but there are many subtleties and complexities in the internal architecture, components, and actually making of the measurements. As shown in (Figure 2), S-parameters S11 = A/R1 and S21=B/R1, and are determined by measuring the magnitude and phase of the incident (R1), reflected (A) and transmitted (B) voltage signals when the output is terminated in a perfect Zo, the characteristic impedance of the test system.

Due to this set-up condition, it is guaranteed that R2 is zero since there is no reflection from an ideal load. (Recall that S11 is equivalent to the input complex reflection coefficient or impedance of the DUT, and S21 is the forward complex transmission coefficient.) Similarly, by placing the source at port 2 and terminating port 1 in a perfect load (making R1 zero), then S22 (=B/R2) and S12 (=A/R2) measurements can be made. (again, recall that S22 is equivalent to the output complex reflection coefficient or output impedance of the DUT, and S12 is the reverse complex transmission coefficient.)
Q: What are some typical S-parameter results?
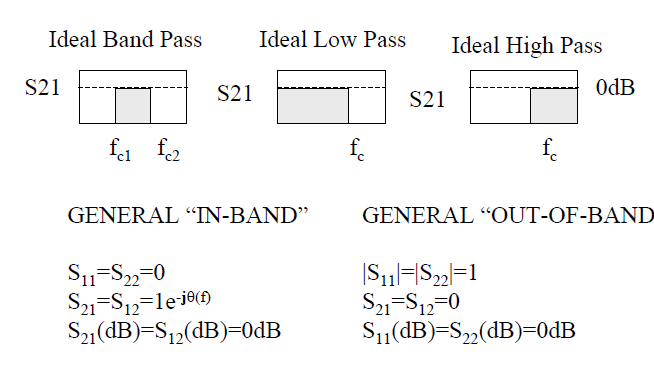
A: There are no “typical” results, but it is interesting to look at some “idealized” cases (Figure 3).
Q: Who makes VNAs?
A: There are many vendors; among them are Keysight, Anritsu, Rohde & Schwarz, Polar Instruments, Saelig Corp., National Instruments, and Tektronix. There are also many lesser-known vendors of VNAs for the lower frequencies where the underlying VNA technology and calibration are not as complicated (but it is still quite advanced; it’s only a relative comparison). A standalone VNA costs between $5000 and $50,000 depending on frequency and performance.
This Keysight E5061B ENA Vector Network Analyzer ($29,000) handles up to 3-GHz tests and features 120 dB of dynamic range – an important figure of merit for accurate results. It handles both 50 Ω and 75 Ω impedance arrangements via the GHz-class connectors for the two ports on the front panel (Figure 4).

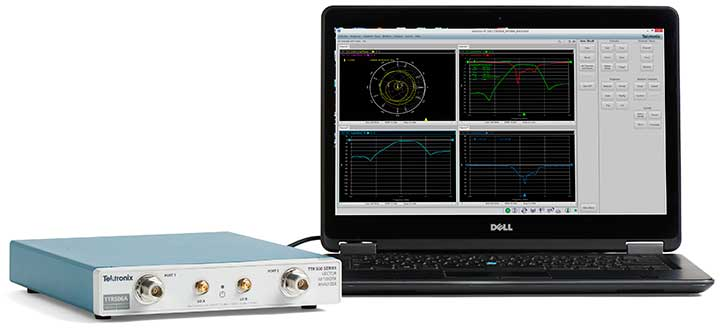
There are also VNAs that use a front-end box for the RF/microwave functions in conjunction with a PC connected via a USB port. For example, the Tektronix TTR500 ($9,000) is a 100 kHz to 6 GHz VNA with over 122 dB dynamic range, -50 to +7 dBm output power, and < 0.008 dB RMS trace noise, (Figure 5).
In general, high-performance VNAs (as determined by frequency range, dynamic range, noise floor, and other specifications) are among the more expensive class of RF test equipment. Some VNAs also can perform a time domain reflectometry (TDR) measurement, which allows for comparison and correlation with the VNA measurements.
Q: I see test instruments called portable network analyzers offered for a few thousand dollars – can I use those here?
A: It depends. The reason is that the term “network analyzer” also refers to an unrelated instrument that checks the performance of a data link or data network and provides data such as bit error rate (BER) versus SNR. But there are lower-cost, ruggedized vector network analyzers that can perform the measurements in the field. These are used by RF/microwave technicians for setup, adjustment, and troubleshooting but are usually not adequate for initial design efforts.
(Note that the term “network analyzer” is rarely abbreviated as “NA” since that could also refer to communication networks or even optical parameters such as numerical aperture, while the vector network analyzer is often called the VNA – it’s just one of those things.)
Q: This seems straightforward one you but the VNA, but what are the realities?
A: First, any measurement of amplitude and phase at higher frequencies is challenging and gets more so as the frequency increases. For S-parameters, slight errors, or imbalances in the measurement arrangement can result in significant errors in the final result; the test results are highly sensitive to test imperfections.
Q What are the types of errors?
A: There are three broad types of VNA errors: system errors in the analyzer and test setup; these are consistent and can be calibrated out to some extent; random errors instrument noise (source phase noise, sampler noise, IF noise, and more); and drift errors, which are primarily caused by temperature variation; it, too, can be removed by calibration).
Q: In addition to developing better instruments (speed, precision, noise), what can be done?
A: Since S-parameters measurements are sensitive to internal errors, VNAs usually are used with a special calibration fixture, which consists of a known “load.” This is not just a simple resistor or other passive device. It is a carefully designed and engineered fixture with known characteristics, and it is connected to the VNA via electrically matched cable pairs, with RF connectors suitable for the frequency of interest.
Using this fixture, the VNA can be calibrated, and even the shifts in performance due to temperature can be calibrated and compensated. Each calibration fixture is designed for use up to a maximum frequency, like those for higher frequencies are more costly than those for lower ones. Calibration set-ups and sequences can be manual operations, but many now are automatic operations that record results and implement the needed correction factors.
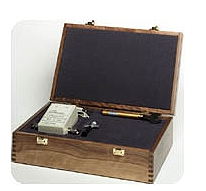
For example, the Keysight 85096C RF Electronic Calibration Module is designed for 300 kHz to 3 GHz operation (Figure 6); it includes Type-N, 75 ohms, 2-port connections, and is traceable to NIST calibration. It consists of a USB interface for PC control along with solid-state switching so it can be configured as needed during the calibration process.
Q: S-parameters are for the frequency domain, but my work is also time-domain related – what are my options?
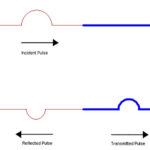
A: There are two options. One is to convert the frequency data of the VNA output to the time domain via an inverse fast Fourier transform (FFT). The other is to use an oscilloscope and capture the data directly in the time domain via a time domain reflectometry (TDR) oscilloscope. This instrument uses a fast step waveform (step generator) with minimal overshoot along with a wideband receiver (sampler) to measure step response. There are also combined VNA/TDR instruments since much of the circuitry, and physical interfaces are similar.
Q: Which is better: the VNA with FFT, or the TDR approach?
A: The answer depends on many factors such as frequency of interest, bandwidth, noise levels, dynamic range, to cite just a few.
Q: There was some mention of the Smith chart earlier; what is the relationship between S-parameters and the Smith chart?
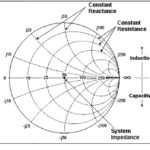
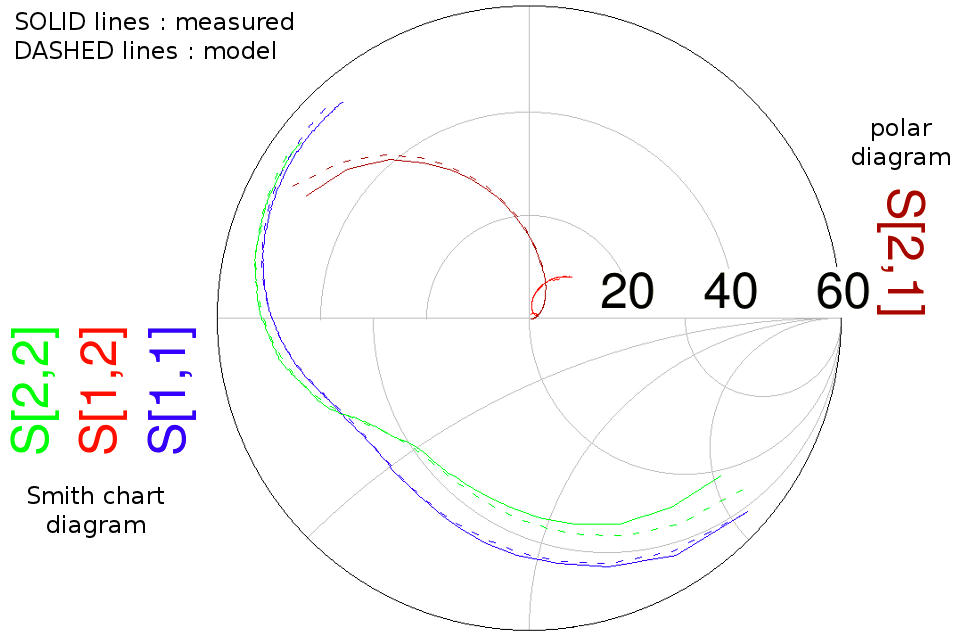
A: The Smith Chart is the most-used graphical representation of the impedance of an RF device or channel versus frequency — and has been in use since the mid-1920s. Although plotted initially on paper, of course, it is now also presented on the screen of a VNA or TDR instrument. The S-parameters can be marked directly onto the Smith chart for significant insight into component and system attributes (Figure 7).
This FAQ has briefly covered a very complicated yet important topic of S-parameters and related issues. There are many good references available ranging from academic and textbook-type treatments to vendor application notes as well as informal, less-intense explanations.
EE World Online References
Impedance matching and the Smith chart, Part 1
Impedance matching and the Smith Chart, Part 2
Printed Circuit Boards, Part 4: Beyond FR-4
Passive microwave components, Part 1: isolators and circulators
Passive microwave components, Part 2: couplers and splitters
Fast interconnect analyzer reveals time- and frequency-domain details in a single acquisition
Load pull for RF devices, Part 2: How and where
Low-Cost Vector Network Analyzer covers up to 6 GHz
VNAs get updated time domain, eye diagram tools.
Other References
- Electrical4U, “Hybrid Parameters or h Parameters”
- Keysight Technologies, “S-Parameter Measurements: Basics for High Speed Digital Engineers”
- IEEE Aerospace Conference Proceedings, “MUSIC algorithm DoA estimation for cooperative node location in mobile ad hoc networks”
- IN3OTD web site, “Mitsubishi RD16HHF1 LDMOS model S-parameters from 50 MHz to 500 MHz”
- Microwaves101, “S-parameters”
- Marki Microwave, “What’s the deal with S-parameters?”
- In Compliance, “S-Parameters Tutorial – Part I: Fundamental Background”
- University of South Florida (via Northern Arizona University), “S-Parameters”
- Tektronix, “What is a Vector Network Analyzer and how does it work?”

