It is now trivial and non-invasive to measure blood-oxygen saturation SpO2, thanks to LEDs, algorithms, and ICs for pulse oximetry — and it’s a very long way from having to draw blood and send it out for assessment.
Just a few decades ago, determining the vital medical parameter known as blood oxygen level — formally called peripheral capillary oxygen saturation, or SpO2 (often written out as SpO2)) — was a challenge. The patient’s blood would be drawn using a needle, and then the sample sent off to a lab. Obviously, this is invasive, time-consuming, costly, and can’t be done on a continuous basis, or even frequently. [Note: when arterial oxyhemoglobin saturation is measured by an arterial blood gas it is referred to as SaO2; when arterial oxyhemoglobin saturation is measured non-invasively by pulse oximetry, it is referred to as SpO2.]
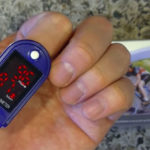
Forward to the present, and you can get a small, clip-on pulse-oximetry unit for about $30-$50 which goes on the finger, and reads out the SpO2 level effortlessly in real time; it is a function which is even built into some wearables. It can be used in clinical settings as well as at home, and no medical or professional experience is needed.
This FAQ will look at how this low-cost, fingertip-based, easy-to-use, and accurate approach to SpO2 measurement was developed, how it works, and how it is realized with modern ICs.
Q: What’s the historical background (in brief, please)?
A: Between 1940 and 1942, Glenn Allan Millikan (an American physiologist working in Britain) used two wavelengths of light from an incandescent bulb fitted with optical filters to produce a rough but practical, all-analog, ear-based oxygen meter dubbed “oximeter.” He noted that light transmitted through a red filter was sensitive to oxygen saturation while light passing through a green filter was independent of oxygen saturation. (It was later determined that oxygen insensitive-signals were not due to the green light filter but instead to infrared light.) The earlobe was used as the measurement region.
Q: That’s all there is to it?
A: Absolutely not. There were other, more advanced attempts along the way, focused on a) developing the needed light sources at the right wavelengths and corresponding optical-electrical sensors, and b) better understanding of the relationship between light transmission at various wavelengths and SpO2 despite variations in blood flow, skin tone, blood pulsing, and many other factors. Q: When did LEDs enter the story?
A: In the late 1970’s, the Biox Corporation in Colorado made significant advances in pulse oximetry, using two-wavelength measurements. They first introduced the use of LEDs for the red and infrared light sources, resulting in continuous, real-time, noninvasive oxygen saturation readings. Since then, improvements in LED performance (color accuracy, consistency of output, and other factors) and photodetector performance have been key parts of the success of turning the concept into a very practical and inexpensive reality. Reference 1 provides more historical background.
Q: So how does pulse oximetry actually work?
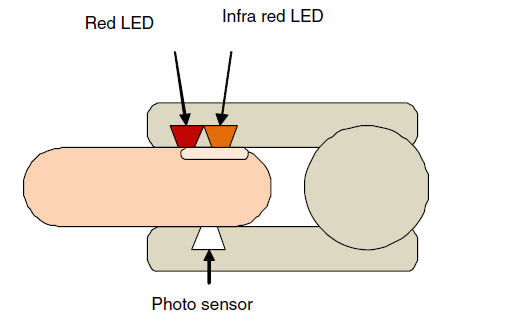
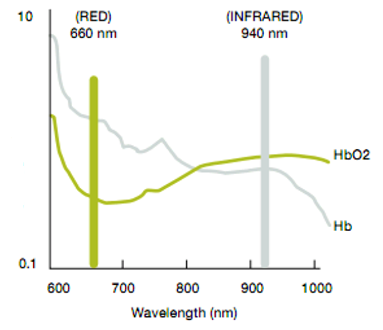
A: The optically based SpO2 approach is elegant and simple in concept, but is fairly complicated in practice. It uses a pair of LEDs – one for IR and one for red visible light – and a single photosensor, Figure 1. The key marker for the SpO2 level is relative attenuation between the two wavelengths, rather than absolute attenuation of either one, Figure 2.
Q: What happens to the optical signal in a modern system?
A: The optical signals are converted to a current (the formal name is photoplethysmography current or just pleth current), digitized, and then processed by complex, sophisticated, medically validated algorithms to provide SpO2 readings in real time.
Q: Sounds complicated — is it?
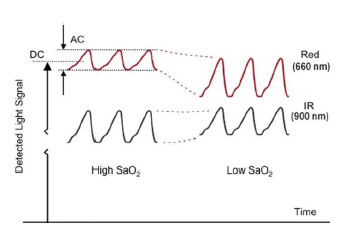
A: Yes, it is, as is almost everything related to the body measurements. Obviously, the blood flow volume is not smooth and constant, of course, but instead “pulses” with the heart’s pumping (Note that this difficulty is actually turned to advantage, since the processing algorithms can use it to determine pulse rate along with the SpO2 reading in a process known as optical heart rate monitoring, or OHRM), Figure 3a and 3b.

Q: What are some of the corrections that must be made?
A: As part of the measurement algorithm, the “raw” signals from the two photosources must be corrected or compensated due to issues of optical signal-path loss and variations, sensitivity, ambient light impact, temperature drift, calibration, filtering, optical “noise” due to unavoidable physical motion between the finger and sensor), and physical packaging.
Q: What does the optical path between LEDs and photosensors look like?
A: The optical path from LED to sensor is not a straight line; further, most of the light is absorbed or scattered before it reaches the photodetector on the other side of the finger (just as when you hold a light to your fingertip and the fingertip “glows”). As a consequence, the relationship between the received photon level and actual SpO2 level is quite complicated. This non-direct light-path scenario greatly complicates the signal-processing algorithms. There is an advantage, however: since the light is severely scattered, the LEDs and photosensor do not even have to be facing each other, but instead can be at right angles or even alongside each other, as is done in some wearables.
Part 2 of this FAQ will look at some of the other critical issues involved when developing a reliable, consistent SpO2 system, as well as how ICs have transformed this previous challenge into a low-cost, accurate product.
References
- org, “History of Pulse Oximetry.”
- American Thoracic Society, “Pulse oximetry”
- Ashfaq Hasan, Handbook of Blood Gas/Acid-Base Interpretation, Chapter 2: “The Non-Invasive Monitoring of Blood Oxygen and Carbon Dioxide Levels,” (Springer).
- “Independent Component Analysis Applied to Pulse Oximetry in the Estimation of the Arterial Oxygen Saturation (SpO2) – a Comparative Study” (Annual Conference of the IEEE Engineering in Medicine and Biology Society, 2009)
- Texas Instruments, SLAA655, “How to Design Peripheral Oxygen Saturation (SpO2) and Optical Heart Rate Monitoring (OHRM) Systems Using the AFE4403”
- Fluke Biomedical, “There’s no such thing as a SpO2 simulator.”
Resources:
NCOA How to Use a Pulse Oximeter